

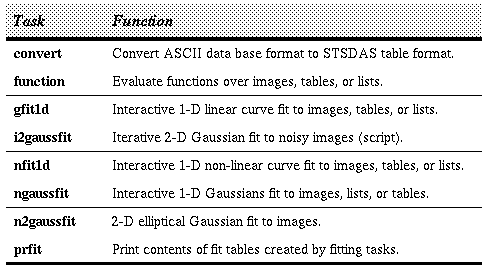
Tasks in Fitting Package
The linear function fitting task is gfit1d.
It fits Chebyshev and Legendre polynomials, and linear or cubic splines, using Cholesky factorization to solve the standard least-squares normal equations. Non-linear function fitting is split between three tasks. The first, nfit1d, supports six different functional forms:
The second non-linear function fitting task,
ngaussfit, is used to fit multiple Gaussians to one-dimensional data. The third task,
n2gaussfit, is a simple non-interactive tool for fitting a two-dimensional Gaussian to image data. The task
i2gaussfit is a script useful for running n2gaussfit with noisy data.
The task function performs the inverse operation, that is, it reads tables containing fitting results and builds images, STSDAS tables, or lists by evaluating the function over the input data coordinates. Another task, prfit, will list or print the fitting table contents in a human-readable format.
The gfit1d, nfit1d, and ngaussfit tasks allow the use of error bars in their fitting operations. These error bars, giving the inverse weighting for each data point, may be used for data from either list or table input. Symmetric error bars are read from a single column of error values, while asymmetric (individual lower and upper) error bars may be read from two error columns.
The gfit1d task uses the IRAF icfit suite of interactive curve fitting tools to perform fitting operations. Interactive graphical curve fitting begins by graphing the data points and the first guess for the function (if any). When the graphics cursor appears the user may modify the graph, the function coefficients, and the control parameters in a number of ways using both cursor mode keystrokes and colon commands. The user then starts the fitting process. The fit can be recomputed as many times as desired before storing the final results in the output table.
The nfit1d and ngaussfit tasks use a suite of interactive non-linear fitting tools, called ncfit, which is based closely on the IRAF icfit package. Non-linear fitting is performed by a least-squares downhill simplex minimization algorithm, which makes the tasks robust, but at some cost in computational speed. Initial guesses for the function coefficients are needed to fit non-linear functions by this method. Guesses can be specified through task parameters, from a previously generated table of results, or interactively after task startup. The n2gaussfit task uses the same numerical techniques, but is non-interactive. Therefore you must specify all initial guesses via task parameters and cannot modify any of the fitting parameters during the fitting process.
The ngaussfit task is really just a special case of the more general nfit1d task where the functional form is restricted to be Gaussian. ngaussfit, however, contains some unique features that allow the user to constrain certain parameters of the fits. For example, when fitting multiple Gaussians the coefficients for all components may either be expressed in absolute units, or you may specify only the first component in absolute units and subsequent components relative to the first (amplitudes as a factor of the first and centers as an offset from the first). This is useful, for example, for constraining spectral line ratios by atomic physics values, or spectral line positions by their difference in wavelength.
The function task evaluates a one- or two-dimensional function that was previously computed by one of the fitting tasks. The function can be evaluated over pixel coordinates in an image section, or over data values in a table column or an ASCII list file. The output will be a one- or two-dimensional image, table column, or list file, depending on the type of input used.
The Gaussian components are described by three coefficients: the amplitude (above the baseline), the center location, and the FWHM. You can interactively define the initial location and amplitude for each feature that you wish to fit by simply placing the cursor at the peak of each feature and typing
Now execute the fitting process by typing
Fitting Hb and [OIII] Emission Features in NGC 4449 Spectrum
Here's an example showing how the
gfit1d and
function tasks can be used to fit and evaluate radial surface brightness data for a galaxy. We'll assume that the surface brightness (magnitudes per unit area) as a function of radius has already been measured using the
ellipse task from the STSDAS isophote package (see "Isophote Fitting" on page 106).
The ellipse task has produced an STSDAS table called a226iso.tab, which contains (amongst others) columns of radius (to the 1/4 power), surface brightness, and lower and upper error estimates of the surface brightness. The labels for these columns are "a**1/4", "mag", "eml", and "emu", respectively. We set the gfit1d task parameters as shown in Figure 5.3.
The input parameter specifies the input table name, as well as the two columns from which the independent and dependent data will be read. The errcolumn parameter is used to specify the two column names from which to read the lower and upper error bar values. When we execute the task we get a plot that looks like Figure 5.4.
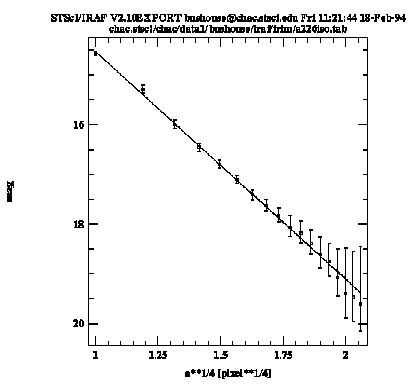
Sample Plot from gfit1d
The solid line in the graph connects the input data points, while the dashed line shows the fit. Upon exiting the task, the function coefficients are written to the STSDAS table a226gfit.tab.
Now, so that later we can make a nice plot of the input data with the fitted function overplotted, we'll use the function task to evaluate the function coefficients stored in a226gfit.tab at the list of radius values in our original data table a226iso.tab. We set the parameters for function as shown in Figure 5.5.
This will evaluate the function over the list of radius values in the column "a**1/4" and create a new column in a226iso.tab called "gfit" that will contain the value of the function at each radius.
Finally, we can use the sgraph
task to produce our final plot. First, we plot the original surface brightness vs. radius data using the following command:
cl> sgraph "a226iso.tab a**1/4 gfit" append+
which tells sgraph to read the X and Y data from columns "a**1/4" and "gfit", respectively, and plot in line mode. The resulting plot is shown in Figure 5.6.
Producing Final Plot with sgraph
Generated with WebMaker
Examples of Using Fitting Tasks
Here's an example of how you can use the ngaussfit task to simultaneously fit several features in an emission-line spectrum. Using all of the default parameter settings for both ngaussfit and the gausspars pset we initiate the task by typing:
fi> ngaussfit n4449.hhh linefits.tab
This reads spectral data from the image n4449.hhh and stores the results of our line fits in the STSDAS table linefits.tab. When the task starts up, it will produce a plot of the spectrum in the graphics window and leave you in interactive cursor mode. At this point you can use the IRAF graphics windowing keystroke command  to window the graph, if desired, to the particular region of interest within the spectrum. Once that is done, you need to define the spectral baseline (continuum) by using the cursor to define the two endpoints of the baseline and typing
  at each location. The baseline will then be overplotted on the spectral data. If the region containing the features to be fitted is a small part of the entire spectrum, then you should also define a sample region within which the fitting will be performed. This will exclude from the fit all data points outside of the sample region and will greatly reduce the processing time of the fitting. Use the
  keystroke to define the two endpoints of the sample region.
 . When you've defined all the features you want, press
  to exit the feature-definition loop. At this point the initial guesses for the FWHM of the defined features will be set to a value of 1.0 and will be set to be held fixed during the fitting. If this value is a reasonable initial guess, then all you need to do is change the coefficients from being fixed to variable using the :var colon command. If you type :show you will see a list of the current values for all coefficients. Coefficients 1 and 2 are the baseline zero point and slope, respectively, and then the coefficients for each of the Gaussian features follow in groups of 3. The first is the amplitude, the second is the center position, and the third is the FWHM. If we have three features defined, for example, coefficients 5, 8, and 11 will be the FWHM of each. To let the FWHM coefficients vary during the fit, issue the colon commands :var 5, :var 8, and :var 11. If you also want to set a different value for the initial guesses for these coefficients, use the :coef colon command: e.g., :coeff 5 6.5 will set coefficient number 5 (the FWHM of our first feature) to a value of 6.5.
 . When the fit has been computed you can replot the solution using the
  keystroke and can examine the results using the :show or :vshow commands. Because the computation of coefficient error estimates is quite CPU-intensive, the default mode of operations is to not perform error estimation. If you want to estimate errors it is most efficient to first iterate to a good fit with error estimation turned off, then issue the command :errors to turn error estimation on and reiterate on the fit one more time by pressing
again. Also note that by default the baseline coefficients are held fixed; you may want to allow these to vary (use the :var command) in order to achieve a better baseline fit than what you're able to define using your eye. Figure 5.1 shows the results of fitting the Hb and [OIII] emission features in our spectrum of NGC 4449. Figure 5.2 lists the resulting coefficients and error estimates (in parentheses).
keystroke and can examine the results using the :show or :vshow commands. Because the computation of coefficient error estimates is quite CPU-intensive, the default mode of operations is to not perform error estimation. If you want to estimate errors it is most efficient to first iterate to a good fit with error estimation turned off, then issue the command :errors to turn error estimation on and reiterate on the fit one more time by pressing
again. Also note that by default the baseline coefficients are held fixed; you may want to allow these to vary (use the :var command) in order to achieve a better baseline fit than what you're able to define using your eye. Figure 5.1 shows the results of fitting the Hb and [OIII] emission features in our spectrum of NGC 4449. Figure 5.2 lists the resulting coefficients and error estimates (in parentheses).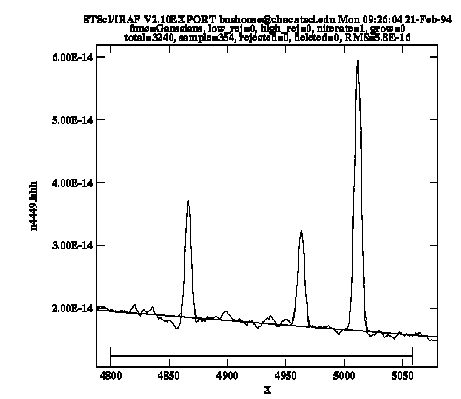
Coefficients and Error Estimates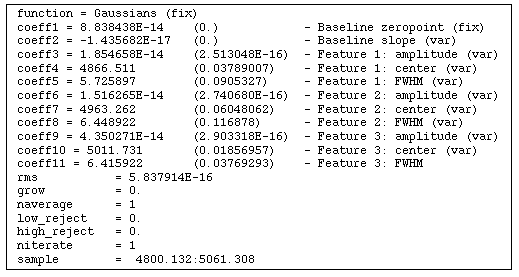 function = Gaussians (fix)
coeff1 = 8.838438E-14 (0.) - Baseline zeropoint (fix)
coeff2 = -1.435682E-17 (0.) - Baseline slope (var)
coeff3 = 1.854658E-14 (2.513048E-16) - Feature 1: amplitude (var)
coeff4 = 4866.511 (0.03789007) - Feature 1: center (var)
coeff5 = 5.725897 (0.0905327) - Feature 1: FWHM (var)
coeff6 = 1.516265E-14 (2.740680E-16) - Feature 2: amplitude (var)
coeff7 = 4963.262 (0.06048062) - Feature 2: center (var)
coeff8 = 6.448922 (0.116878) - Feature 2: FWHM (var)
coeff9 = 4.350271E-14 (2.903318E-16) - Feature 3: amplitude (var)
coeff10 = 5011.731 (0.01856957) - Feature 3: center (var)
coeff11 = 6.415922 (0.03769293) - Feature 3: FWHM
rms = 5.837914E-16
grow = 0.
naverage = 1
low_reject = 0.
high_reject = 0.
niterate = 1
sample = 4800.132:5061.308
function = Gaussians (fix)
coeff1 = 8.838438E-14    (0.)            - Baseline zeropoint (fix)
coeff2 = -1.435682E-17   (0.)            - Baseline slope (var)
coeff3 = 1.854658E-14    (2.513048E-16)  - Feature 1: amplitude (var)
coeff4 = 4866.511        (0.03789007)    - Feature 1: center (var)
coeff5 = 5.725897        (0.0905327)     - Feature 1: FWHM (var)
coeff6 = 1.516265E-14    (2.740680E-16)  - Feature 2: amplitude (var)
coeff7 = 4963.262        (0.06048062)    - Feature 2: center (var)
coeff8 = 6.448922        (0.116878)      - Feature 2: FWHM (var)
coeff9 = 4.350271E-14    (2.903318E-16)  - Feature 3: amplitude (var)
coeff10 = 5011.731       (0.01856957)    - Feature 3: center (var)
coeff11 = 6.415922       (0.03769293)    - Feature 3: FWHM
rms           = 5.837914E-16
grow          = 0.
naverage      = 1
low_reject    = 0.
high_reject   = 0.
niterate      = 1
sample        =  4800.132:5061.308
Parameters for gfit1d input = a226iso.tab a**1/4 mag >data to be fit
output = a226gfit.tab >output table
(axis = 1) >axis to project onto if we are fitting 2D image
(sample = *) >sample points to use in fit
(xmin = INDEF) >limits for normalization
(xmax = INDEF)
(errcolu= eml emu) >column name for error column if fitting table
(functio= spline1) >fitting function
(order = 1) >order of fitting function
(ps = yes) >output as power-series polynomial ?
(interac= yes) >set fitting parameters interactively?
(naverag= 1) >number of points in sample averaging
(low_rej= 0.) >low rejection in sigma of fit
(high_re= 0.) >high rejection in sigma of fit
(niterat= 1) >number of rejection iterations
(grow = 0.) >rejection growing radius in pixels
(device = stdgraph) >graphics output device
(cursor = ) >graphics cursor input
input   = a226iso.tab a**1/4 mag  >data to be fit
output  =         a226gfit.tab  >output table
(axis   =                    1) >axis to project onto if we are fitting 2D image
(sample =                    *) >sample points to use in fit
(xmin   =                INDEF) >limits for normalization
(xmax   =                INDEF)
(errcolu=              eml emu) >column name for error column if fitting table
(functio=              spline1) >fitting function
(order  =                    1) >order of fitting function
(ps     =                  yes) >output as power-series polynomial ?
(interac=                  yes) >set fitting parameters interactively?
(naverag=                    1) >number of points in sample averaging
(low_rej=                   0.) >low rejection in sigma of fit
(high_re=                   0.) >high rejection in sigma of fit
(niterat=                    1) >number of rejection iterations
(grow   =                   0.) >rejection growing radius in pixels
(device =             stdgraph) >graphics output device
(cursor =                     ) >graphics cursor input
Parameter Settings for function Task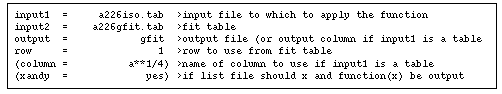 input1 = a226iso.tab >input file to which to apply the function
input2 = a226gfit.tab >fit table
output = gfit >output file (or output column if input1 is a table
row = 1 >row to use from fit table
(column = a**1/4) >name of column to use if input1 is a table
(xandy = yes) >if list file should x and function(x) be output
input1  =     a226iso.tab  >input file to which to apply the function
input2  =    a226gfit.tab  >fit table
output  =            gfit  >output file (or output column if input1 is a table
row     =               1  >row to use from fit table
(column =          a**1/4) >name of column to use if input1 is a table
(xandy  =             yes) >if list file should x and function(x) be output
cl> sgraph "a226iso.tab a**1/4 mag" point+ yflip+ \
>>>   wb=20.3 wt=14.4
This command tells sgraph to take its x and y data from columns "a**1/4" and "mag", respectively, in table a226iso.tab, plot in point mode (as opposed to connected-line mode), flip the Y-axis (because magnitude units run backwards), and set the range of the Y-axis to be from 20.3 to 14.4 (to give a little extra room for the error bars when we plot them next). Now run sgraph a second time in append mode to overplot the error bars:
cl> sgraph "a226iso.tab a**1/4 mag" \
>>>  errcol="eml emu" mark=vebar erraxis=2 app+
This tells sgraph to read the lower and upper error bars from table columns "eml" and "emu", respectively, use a vertical error bar for the marker type, and the error axis is in the Y-dimension (erraxis=2). And finally overplot the fit to the data running sgraph a third time as: