

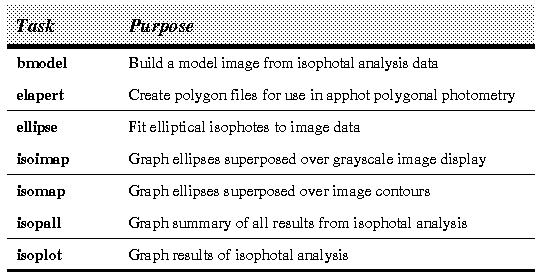
Tasks in isophote Package
The output table from the
ellipse task, containing isophote information, is used as input to the remaining tasks in this package. The task bmodel reads the table and builds an artificial image with a photometric model of the original image. Task elapert is used to build a set of elliptical apertures, to be used with the polyphot task in the noao.digiphot.apphot package, for aperture photometry.
Task isoplot can be used to quickly examine, in graphic form, the run of any isophote parameter against ellipse semi-major axis. Task isopall builds a graphic mosaic simultaneously showing the run of nine isophote parameters against ellipse semi-major axis. Task isomap draws a contour map of the original image, and superposes on it the ellipses corresponding to the contoured levels. In a similar way, task isoimap superposes ellipses on the grayscale image display.
To use the ellipse task, the user specifies values for the semi-major axis length (a0), the X and Y axis center (x0 and y0), the ellipticity (eps0), and the position angle of the semi-major axis (teta0). These parameters can be set in several ways:
When the task starts up you will be left in graphics cursor mode, at which point you can set the necessary first-guess values for the ellipse parameters. First, position the cursor in the image display at the desired center location for the first ellipse and then press
To proceed with the fitting, you can press
Using the initial ellipse values, the image is sampled along a first-guess elliptical path, producing a one-dimensional intensity distribution as a function of the ellipse eccentric angle. The harmonic content of this distribution is analyzed by fitting it to the following least squares function:
From the harmonic amplitudes (A1, B1, A2, B2), and from the local image gradient, correction factors can be derived for each sampling ellipse parameter (keeping a0 fixed). The parameter that corresponds to the largest amplitude is varied, and the image is resampled. This process is repeated until any one of the following criteria are met:
After fitting the ellipse that corresponds to a given value of the semi-major axis (by the process described above), the axis value is increased by a factor of (1. + astep), and the process is repeated until either the semi-major axis value reaches the value maxa, or the last fitted ellipse has more than 50% of its sampled points flagged with INDEF values. The process then resumes from the first fitted ellipse (a0) inwards, in steps of (1./(1. + astep)), until the semi-major axis length reaches the value mina. At each step, the starting ellipse parameters are taken from the previously fitted ellipse that has the closest semi-major axis length.
On low surface-brightness regions (i.e., those having large radii), the small values of the image radial gradient can result in large corrections and meaningless values for the ellipse parameters. In this case, the iterative mode is disabled and geometric parameters keep their last stable values. This non-iterative mode is entered when one of the following criteria are met:
If any sector vertex is outside the image boundary, its corresponding sample point is flagged as INDEF. The value of integrmode is ignored when the distance between the present ellipse and the next ellipse is less than 2 pixels, or when the semi-major axis is less than 20 pixels; in these cases, bi-linear interpolation is always used. The mean and median methods execute 3-5 times slower than bi-linear interpolation.
The basic convergency criterion (i.e., the crit variable), is defined as follows. In the case of bi-linear interpolation, it has a fixed value of 4%. In the case of either mean or median over elliptical annulus sectors, however, the increased number of pixels counted inside each sector as the algorithm proceeds outwards, will tend to decrease the rms residual against which harmonic amplitudes are compared. This will, on one side, increase the sensitivity to low-amplitude harmonics, and on the other side will increase the number of iterations necessary for the criterion to be met. The task parameter conver can be used to decrease the algorithm sensitivity in the outer regions of images, where sectors are large. The value of crit is defined as:
Errors for all parameters are obtained directly from the rms scatter of intensity data along the fitted ellipse.
For the sake of convenience, task output includes semi-major axis length raised to the 1/4 power, as well as isophotal intensities and errors expressed in a rough magnitude scale. This scale is derived from the parameters mag0, refer, and dark, and from the mean isophotal intensity int, according to the following relation:
Stop Condition Codes
The last column contains the average, along the elliptical path, of the absolute value of the error (in percent) between the true geometric area of each sector and the image area effectively used for that sector.
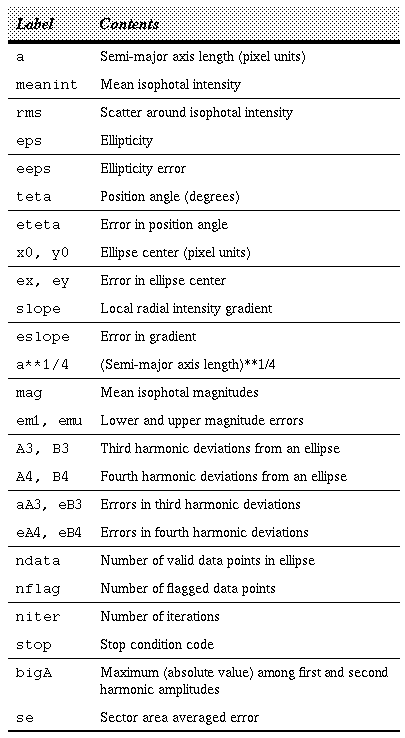
If the output is in the form of an STSDAS table, it will contain one row for each value of the semi-major axis. The labelling of each column is described in Table 5.4.
Column Labels
If the main output is in the form of character-oriented tables, their names will be constructed by concatenating the string passed to output with suffixes 1, 2, 3 and 4. Their contents will be as follows:
File 1: Semi-major axis length, mean intensity of isophote and its rms, ellipticity and its error, position angle and its error, maximum among first and second harmonic amplitudes.
File 2: Semi-major axis length, coordinates of the center and their errors, gradient of image and its error, number of valid data points used in the fit, number of flagged data points extracted from the image, number of iterations, and stop condition code.
File 3: Semi-major axis length, higher order harmonic deviations from a perfect ellipse (n = 3 and 4) and their errors.
File 4: Semi-major axis length, (semi-major axis length)**(1/4), isophotal magnitude, lower and upper magnitude error bars, sector area averaged error.
The user can generate a set of files containing the intensity sample from the image corresponding to a fitted isophote. These are ASCII text files and are created only when a value is passed to the samplef parameter. The files will have the root name specified by samplef and the extensions .001, .002, .003, etc. Each file will contain one sample point (eccentric angle, intensity pair) per line, preceded by comment lines with identification data. These files are compatible with the sgraph task, allowing isophotal data to be quickly examined using graphics.
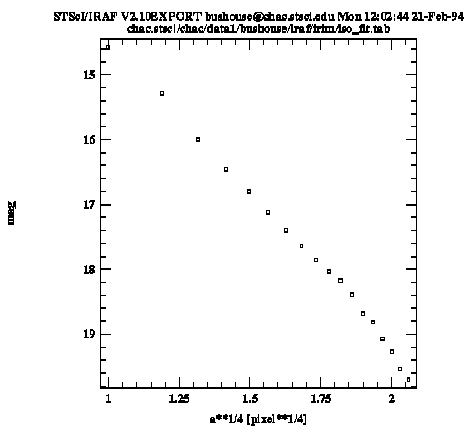
Figure 5.8 shows a subset of output table columns for the example ellipse run described earlier. The sgraph task can be used to easily examine these data, for example, the following command will produce a plot of position angle as a function of radius:
Subset of Table Output from ellipse Task
Plot of Isophotal Surface Brightness
Generated with WebMaker
Here's an example of how these parameters can be specified when running the task interactively. First, display the desired image in the image display window (i.e., using SAOImage or imtool in conjunction with the tv.display task). Now start the ellipse task using the parameter settings shown in Figure 5.7.
input   =         my_image.hhh  input image name
output  =          iso_fit.tab  output table name
(sdas   =                  yes) output table will have sdas format ?
(interac=                  yes) set fitting parameters interactively?
(device =                 imdy) graphics output device
(imcur  =                     ) image cursor input
(gcur   =                     ) graphics cursor input
(initfil=                     ) file with initial ellipse points
(samplef=                     ) files with intensity samples
(badpixe=                     ) bad pixel list
(harmoni=                     ) optional harmonic numbers
(x0     =                INDEF) initial ellipse center
(y0     =                INDEF)
(eps0   =                INDEF) initial ellipticity
(teta0  =                INDEF) initial position angle
(hcenter=                   no) hold center fixed ?
(heps   =                   no) hold ellipticity fixed ?
(hteta  =                   no) hold position angle fixed ?
a0      =                  10.  initial semi-major axis
mina    =                   1.  minimum semi-major axis
maxa    =                  18.  maximum semi-major axis
(astep  =                   1.) step between successive ellipses
(linear =                  yes) linear astep ?
(minit  =                    8) minimun no. of iterations
(maxit  =                   50) maximun no. of iterations
(lslope =                   0.) limit for acceptable slope
(conver =                   0.) convergency sensitivity control
(clip   =                   0.) fraction of points to clip off
(maxrit =                INDEF) max. semi-major axis for iterative mode
(integrm=            bi-linear) area integration mode
(mag0   =                 22.5) magnitude of reference source
(refer  =                   1.) intensity of reference source
(backgr =                   0.) intensity of background signal
(star   =                   0.) star removal radius
Sample Parameter Values . This will define parameters x0 and y0. You can then either position the cursor at the desired starting radius and position angle and press
  to redefine the a0 and teta parameters, or you can enter a value from the keyboard by typing :teta 0.0, for example. Finally, the initial value for eps is defined by entering a value from the keyboard, such as :eps 0.1. Before attempting the fit for the first ellipse you can review the current parameter settings by typing :show. If none of the displayed parameters have values of "INDEF" you are ready to proceed with the fitting.
 to compute a fit for the current isophote, press
  to proceed to the next isophote, or press
  to continue the fitting in non-interactive mode.
In any case, a minimum of minit iterations are performed. If the iterations stop because of reasons 2 or 3 above, then those ellipse parameters that generated the lowest absolute values for harmonic amplitude will be used. At this point, the image data sample coming from the best fit ellipse is fitted by the following function: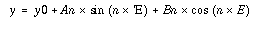
where n = 3 and n = 4. The amplitudes (A3, B3, A4, B4), when divided by the semi-major axis length and local intensity gradient, measure the isophote's deviations from perfect ellipticity--these parameters, all other associated isophote parameters, and some auxiliary information, are written to the output file.
Three methods are available for sampling an image around the elliptical path: bi-linear interpolation, and either mean or median over elliptical annulus sectors. These modes are selected using the task parameter integrmode. Bi-linear interpolation extracts a 1-pixel width sample from the image. When using this technique, and when the distance between successive ellipses exceeds 2 pixels, many pixels will never be sampled. Integration over elliptical annuli can be used, however, to extract all information from the image array. The width of a given annulus is set from halfway between the present ellipse and the previous one to halfway between the present ellipse and the next one. Annuli are divided in sectors, and the angular step between successive sectors makes their areas approximately constant over a given annulus. The angular span of a given sector is, however, restricted to a maximum of 12 degrees. Individual image pixels are considered to be inside a sector if more than half of the pixel area is inside that sector, otherwise they are not counted. The resulting sample point for that particular sector will be the arithmetic mean or the median of all the non-INDEF pixels inside the sector. The percentage difference between the true geometric area of the sector and the image area effectively sampled in that sector is a measure of the sampling technique geometric error. The average, along the elliptical path, of its absolute value for each sector, is output for each fitted isophote.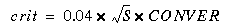
where S is the sector area (kept approximately constant along the ellipse) in units of pixel2. Thus conver=1.0 should, in principle, cancel the effect of the smaller rms residual that is caused by integration over larger areas, when compared with bi-linear interpolation. This will, however, retain all data for the full image area in the resulting sample. Larger values of conver will relax the criterion while smaller values will tighten it. If conver = 0.0, the crit parameter will be fixed at 4% regardless of the integration method used.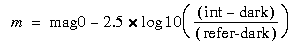
Output directed to STDOUT is a table with one row for each semi-major axis length. Each row contains the following data: semi-major axis length, mean isophotal intensity and its rms, ellipticity and its error, position angle and its error, number of valid data points used in the fit, number of flagged data points extracted from the image, number of iterations, and stop condition code. The stop code can have the values listed in Table 5.3. 
cl> sgraph "iso_fit.tab a teta"
Similarly, the following command will produce a plot of mean isophotal surface brightness (magnitudes per unit area) as a function of radius to the 1/4 power (Figure 5.9).
cl> sgraph "iso_fit.tab a**1/4 mag" yflip+ point+


Table iso_fit.tab  Mon 11:32:35 21-Feb-94

      a     a**1/4      x0      y0    meanint     mag    eps    teta
  pixel pixel**1/4   pixel   pixel                           degrees

   1.00    1.00000   30.05   33.95      1478.    14.6 0.0690    1.29
   2.00    1.18921   30.02   33.84       770.    15.3 0.0690  -67.62
   3.00    1.31607   30.04   33.70       398.     16. 0.0612  -67.62
   4.00    1.41421   30.02   33.73       260.    16.5 0.0976  -48.33
   5.00    1.49535   30.03   33.69       191.    16.8 0.1450  -50.65
   6.00    1.56508   29.98   33.75       142.    17.1 0.1473  -51.34
   7.00    1.62658   29.87   33.77       110.    17.4 0.1424  -50.05
   8.00    1.68179   29.86   33.28       87.6    17.6 0.1277  -41.92
   9.00    1.73205   30.04   33.49       72.1    17.9 0.1414  -28.30
  10.00    1.77828   30.31   33.62       61.1     18. 0.1564  -43.41
  11.00    1.82116   30.18   33.53       53.6    18.2 0.1934  -45.21
  12.00    1.86121   30.13   33.18       43.8    18.4 0.1738  -49.85
  13.00    1.89883   29.94   32.86       33.4    18.7 0.1265  -61.13
  14.00    1.93434   30.23   33.08       29.8    18.8 0.1623  -55.11
  15.00    1.96799   30.16   33.13       23.5    19.1 0.1408  -55.11
  16.00    2.00000   30.16   32.68       19.6    19.3 0.1408  -43.31
  17.00    2.03054   29.68   32.17       15.4    19.5 0.1408  -43.45
  18.00    2.05977   29.40   33.05       13.2    19.7 0.1408  -43.45