Entry 10
Authors
- Damian Avila
Abstract
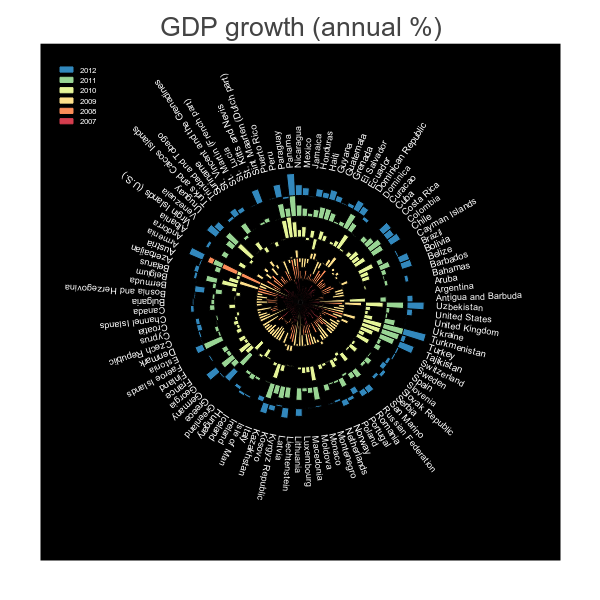
This aim of this figure is to understand the complex spatiotemporal evolution of the main economic indicator for countries: the Growth Domestic Product (GDP). Usually, the temporal evolution of GDP by country can be observed in bar plots, one for each country, spanning a predetermined range of years. Or you can see a GDP bar plot for many countries, but only showing you one specific year. This kind of partial visualizations have a lot of problem at the time to integrate all the available information. So, trying to solve this problem, we developed a new kind of visualization, based in a circular representation of the data. Each circle (level) is representative from one year in the range 2007-2012, and each bar is assigned to an specific country. In this way, we have the best of the both worlds, because we can see and compare the GDP for each country in a specific year of interest, but we can also see the GDP temporal evolution from 2007-2012 for a specific country of interest. Finally, the possibility to have all the information available in the same plot, let us discover hidden patterns, for instance, you can see two main “zones” in our plot. The top half of the circles show us positive GDP in the majority of the countries in the las year, and this zone is populated with third world country who perform better in the last years of economic crisis. In the other way, the bottom half of the circle contained the European countries who perform very bad during the last years causing, in fact a big part of the crisis. As a plus, the figure is interactive: you have some buttons at the top of the figure with many of the available functionalities, ie. you can move it around, zoom in and zoom out to explore specific regions, and you can also easily preview or save the figure. To conclude, we provides a new and powerful visualization, which let us understand complex iterations between different parameters, making the a more integrated interpretation of the facts we observed.
This plot was done using Bokeh, a new pythonic and very powerful visualization tool with a lot of great features. You can easily install it using conda or pip.
The original database was obtained from WorldBank.