Entry 11
Authors
- Olly Downs
- Luca Cazzanti
- Matthew Danielson
- Jesse Hersch
- Julie Penzotti
- Carl Sutherland
- Garrett Tenhold
- Courosh Mehanian
Abstract
The Longitudinal Customer View charts the rich transactional data of a prepaid mobile phone subscriber in time and demonstrates the impact of marketing activity on a user’s behavioral patterns. Traditional mobile carriers have rarely tracked individual customer behavior on a time dimension and therefore lack key knowledge about the life cycles of their subscribers. This longitudinal view provides unique insights into usage patterns that represent opportunities for marketing and facilitates a better understanding of how marketing offers alter customer behavior. Longitudinal representations for millions of subscribers are the basis for our big data platform for scientific and contextual marketing for mobile carriers.
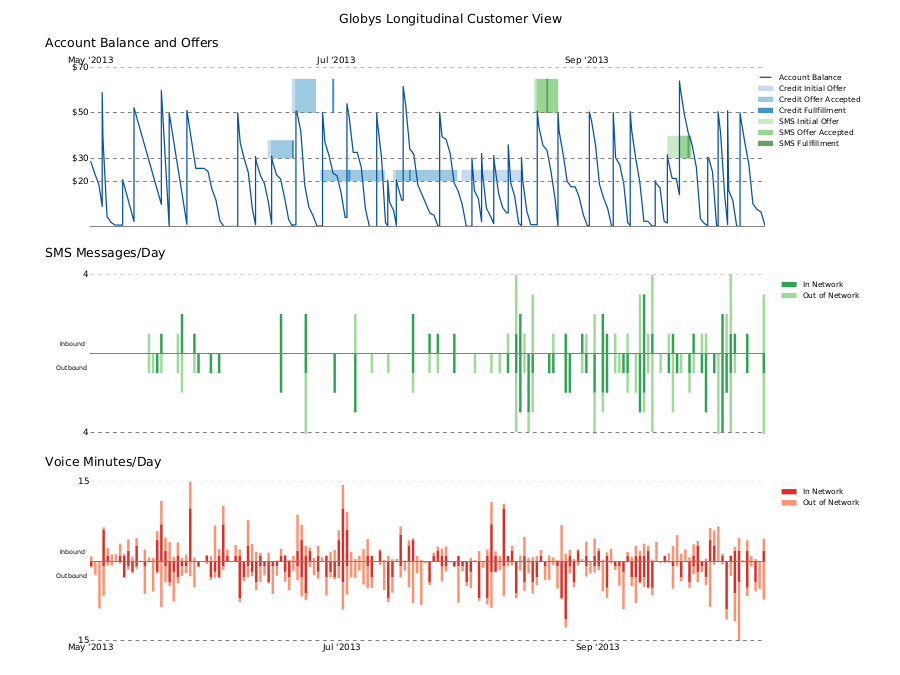
The Longitudinal View plot captures customer usage, credit balance, and marketing offer acceptance on a unified time scale, enabling a quick assessment of customer behavior at any individual point in time. In the top chart, the account balance trajectory of the customer shows when money is added to the account (recharges) and when it is consumed. Marketing activity is depicted as boxes alongside the balance which encode the following information:
- Type of offer: Overall color scheme of the box, in this case bonus credit (blue) or SMS (green)
- Minimum required recharge amount to qualify for offer: Distance of box from x-Axis
- Offer incentive value: Height of Box
- Duration offer is valid: Length of Box
- Offer acceptance and fulfillment: Different color shades, and position along the x-axis
By noting where the balance line briefly intersects with the boxes in the top chart, it is clear that this customer accepted all of the marketing offers, typically early within the offer expiry period, by recharging for a qualifying amount. However, a credit offer in August was not recorded as accepted (nor fulfilled) by the carrier, despite repeated qualifying recharges by the customer as shown by the balance line intersecting with the offer box multiple times.
Equal y-axis scales on the usage plots below allow quick inspection of whether a customer tends to send or receive more communication events, and the colors delineate the amount of communication that takes place within the carriers own network or outside. The middle bar chart plots SMS messages received (up) and sent (down) by day. Similarly the bars in the bottom chart are voice usage activity: total inbound (up) and outbound (down) voice minutes used per day. Periods of higher usage are coincident with faster balance consumption and more frequent recharges or recharges for larger denominations. With the unified time scale across all plots, the introduction of an SMS offer (green box) is shown to correspond to increased SMS activity, and the increased SMS usage continues with an additional offer sent the following month. The longitudinal view truly provides a window into the life cycle and usage behavior of mobile subscribers.