Entry 14
Authors
- Evan Couzo
Abstract
Houston, you have an ozone problem.
Ozone (\(O_3\)) is a harmful air pollutant that forms when nitrogen oxides and hydrocarbons react in the presence of sunlight. Houston, Texas, has some of the worst \(O_3\) pollution in the U.S. because (1) Houston often suffers from stagnant meteorological conditions that lead to \(O_3\) accumulation, (2) nitrogen oxide emissions are large due to the vast number of automobiles, and (3) the petrochemical industry emits highly reactive compounds, which accelerate the rate of \(O_3\) production. This last reason - industrial petrochemical emissions - has been the focus of intense study and regulatory action.
Many of Houston’s highest \(O_3\) concentrations are characterized by rapid increases in concentrations of at least 40 ppb in one hour, or 60 ppb in two hours. These rapid increases are called non-typical \(O_3\) changes (NTOCs) and are unique to Houston. It is believed that many NTOCs are caused by sudden releases of reactive hydrocarbons from petrochemical facilities. Using publicly available air quality monitoring data from 2000-2011, this analysis maps the geographic origins of NTOCs at six air quality monitors across Houston.
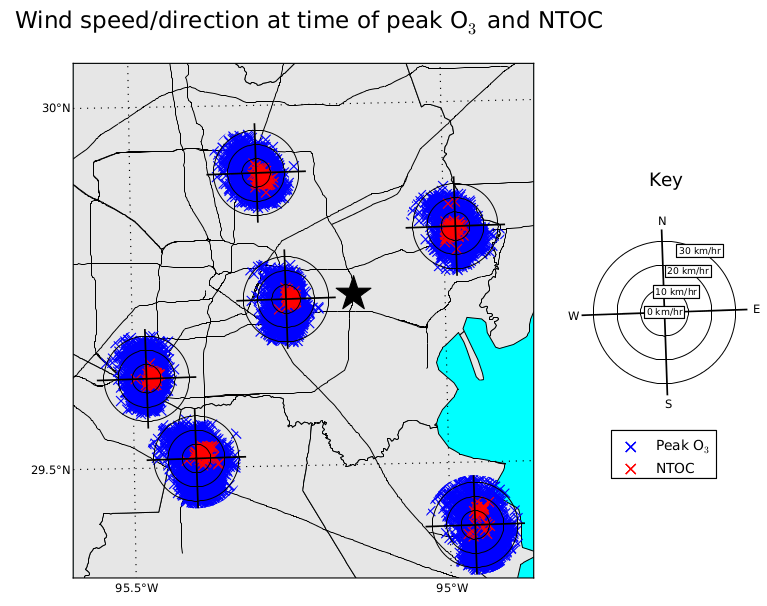
This figure shows that NTOCs are measured at air quality monitors when they are downwind of Houston’s petrochemical industry, the heart of which is marked by the black star in the figure. Each of the six radar plots is centered on the location of an air quality monitoring station. The theta-axis shows wind direction, and the r-axis shows wind speed. Each red marker shows the wind speed and direction when a NTOC was measured, i.e., when the air quality monitor detected an extremely rapid \(O_3\) increase. Although there is some scatter in each plot, there is a strong preference for a narrow range of wind directions. The red markers are clustered in the direction of the Houston’s petrochemical industry (black star), which means NTOCs tend to occur at monitors when they are downwind of the petrochemical industry. The blue markers in each radar plot show the wind speed and direction that were measured when daily peak \(O_3\) was measured. These data do not cluster in a particular direction meaning that peak \(O_3\) comes from a diversity of directions.
This figure links geographically the NTOC phenomenon to Houston’s petrochemical industry. It shows that, while peak \(O_3\) has no preference for wind direction, NTOCs tend to happen only when downwind of the petrochemical industry. The figure also shows that NTOCs are measured when wind speeds are relatively low (usually under 10 km/hr, always under 20 km/hr). If wind speeds are too high, industrial petrochemical emissions are transported out of the region before they have a chance to form \(O_3\).
A version of this plot appears in [1].
| [1] | E. Couzo, H.E. Jeffries, and W. Vizuete, 2013. Houston’s rapid ozone increases: preconditions and geographic origins. Environ. Chem., 10, 260-268. doi:10.1071/EN12040. |