Entry 18
Authors
- James Keaveney
Abstract
The refractive index of a medium is an important quantity and is different for different wavelengths of light – this is why a prism refracts white light into a rainbow, for example. At certain frequencies, the material has resonances where the refractive index changes rapidly. Understanding these resonances is important, allowing us to control light propagation speed and signal transmission through these media, which is becoming more and more important, both in atomic physics and in optical communications applications.
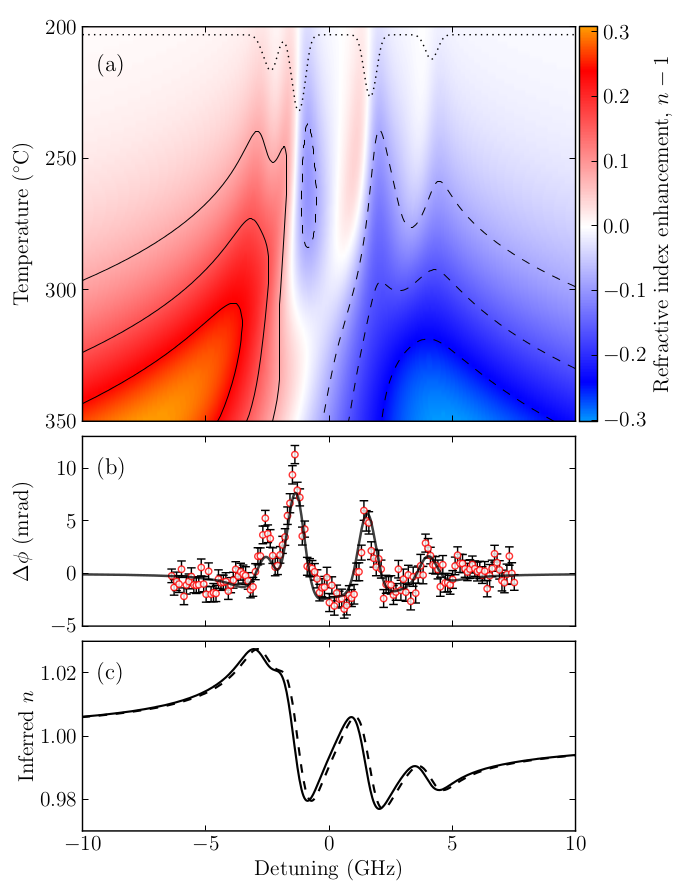
In this plot, we show the refractive index of a Rubidium (Rb) atomic vapour as a function of the frequency of light, in the vicinity of the D2 resonance lines, which physically correspond to an electronic excitation of the single valence electron of the Rb atom.
Panel (a) shows the calculated refractive index, which is strongly dependent on the temperature of the atomic vapour. As the temperature rises, more atoms are in the vapour phase and the magnitude of the refractive index increases, as shown by the colour map (the contours allow the colour map to still be understood when printed in black and white). The dotted line in this panel shows the four main resonance lines, and their width in frequency space. Importantly, this panel shows that as temperature is increased the refractive index does not keep increasing infinitely far, but instead saturates at a maximum value of n=1.31, which has important implications for light pulse propagation through the medium, and hence signal transmission applications.
Panels (b) and (c) show experimental data. We use a laser with a single frequency of light that can be tuned across the resonance – the ‘detuning’ axis is how far the laser frequency is from the weighted centre of the 4 resonance lines. From this laser we generate a second beam, which is shifted relative to the first beam in frequency by 80 MHz, and we send both through the Rb vapour. Since the beams have slightly different frequencies, they see slightly different refractive indices and therefore propagate at a different speed (c/n). There is therefore a phase shift between these two beams that changes with the laser detuning. This data comes from a vapour where the vapour density is such that the laser only interacts, on average, with a single layer of atoms, and so the magnitude of the phase shift is very small, just a few milli-radians (mrad), but is detectable using sensitive photodiodes.
From this phase shift data, we are able to reconstruct the refractive index profile of the medium using a theoretical model, and this is shown in panel (c). For this specific experimental data set, which is at 220oC, we infer a refractive index that varies between 1.027 and 0.975. The solid and dashed lines show the refractive indices experienced by the first and second beams, which are shifted relative to each other.
For more information about this plot and the underlying physics, please see either Phys. Rev. Lett. 109, 233001 (2012), or my Ph.D. thesis, available from http://etheses.dur.ac.uk/7748/