Entry 2
Authors
- Robert Paruch
Abstract
The erosion of a solid due to energetic particle bombardment is modeled with atomistic molecular dynamics simulations. The objective of the simulation is to determine the position of a buried layer (called a 𝛿-layer) by measuring the composition of what is removed. The process is complex as each incident particle, such as a buckyball – \(C_{60}\), can remove material (called sputtering) from several different layers and can displace material from one layer to another either upward or downward. The quantity that is measured is the material removed from the delta layer which had an initial space-fixed position. The amount of material removed (sputtered) and displaced, however, is relative to the average position (average level) of the eroded surface that is roughened with root-mean-square (rms) roughness. The graphical and computational challenge is to present all this information in a compact form so that the physics can be interpreted. These quantities ultimately go into a kinetic model to determine the experimentally measured depth profile [1].
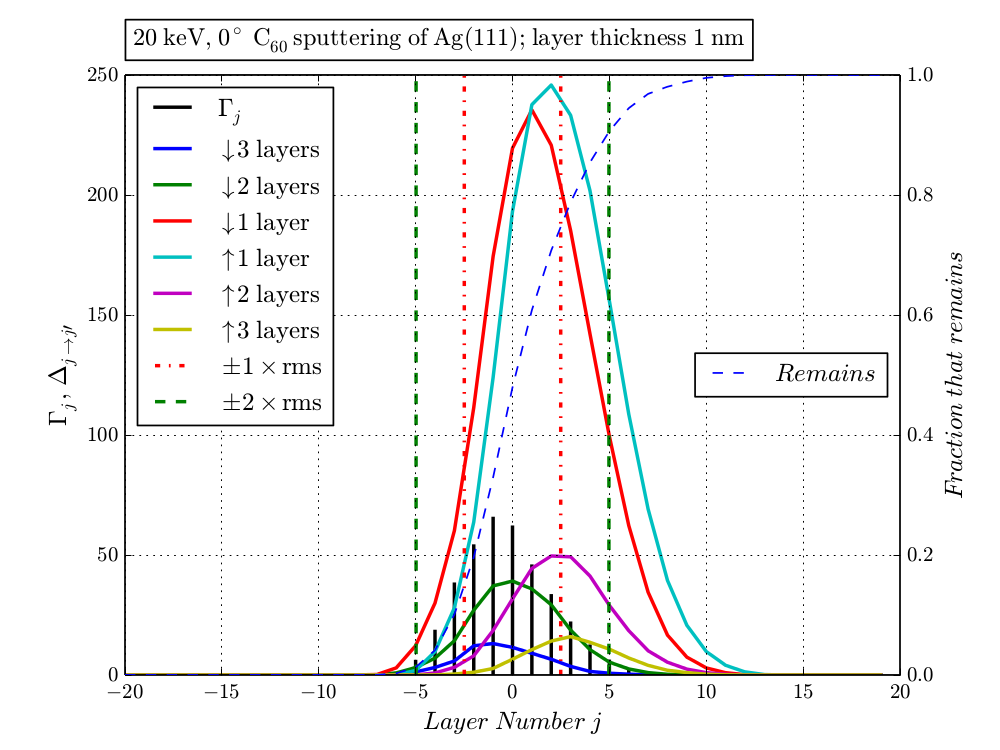
The plot presents the sputtering and displacement distributions obtained for \(20 \mathrm{keV C_{60}}\) erosion of a silver sample. In order to calculate the distributions, the sample was divided into horizontal layers of approximately 1 nm thickness. The horizontal sample layers are numbered by the \(j\) index where \(j=0\) denotes the average level of the eroded surface. The indices \(j<0\) and \(j>0\) denote the layers above and below the average level, respectively. The sputtering distribution \(\Gamma j\) is shown as vertical black bars. The \(\Gamma j\) value denotes the average number of atoms per impact that is sputtered from the \(j\)-th sample layer. The displacement distribution \(\Delta_{j\rightarrow j\prime}\) in average number of atoms per impact is shown as solid lines for atom movement by a given number of layers as color coded in the legend. The red and green vertical dashed lines mark the ±1 and ±2 × rms surface roughness distances from the average surface level. The dashed blue line shows the fraction of a layer atom occupation that remains in the layer, that is, is neither sputtered nor displaced.
This plot constitutes a compact visual description of complex sputtering and bombardment induced atom displacement phenomena in the eroded sample. By visual inspection one can see that the sputtering distribution is within the roughened surface, that is, between +2 and −2 × rms roughness marks. The displacement distribution for moving up and down one layer extends far below the −2 × rms roughness mark, that is, below the roughened surface. Moreover, the amount of displacement is considerably larger than the amount of sputtering. From additional simulations we have shown that to improve the quality of the depth profile, the experimentalist can move the angle of incidence of the beam to more grazing incidence, make the cluster larger, such as \(Ar_{872}\), or decrease the incident energy.
| [1] | R.J. Paruch, Z. Postawa, A. Wucher, B.J. Garrison, Steady-State Statistical Sputtering Model for Extracting Depth Profiles from Molecular Dynamics Simulations of Dynamic SIMS, J. Phys. Chem. C, 116 (2012) 1042-1051. |