Entry 4
Authors
- Juraj Sukop
Abstract
Line breaking is a problem of arranging the words to the lines so that a specific constraint becomes satisfied. One such objective usually used is the “minimum raggedness” strategy which tries to compute the configuration of lines with the most even margin. The “evenness” is then defined as the smallest sum of squares of the lengths of whitespace left on lines. There are numerous approaches with varying time (and code) complexities and degrees to which a method takes advantage of the underlying problem.
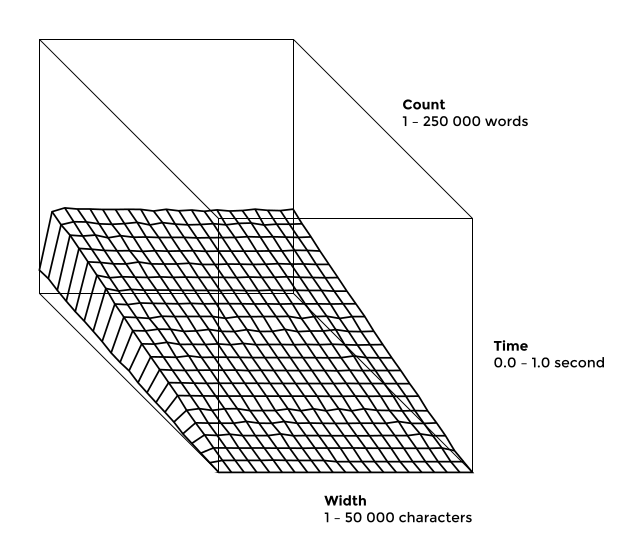
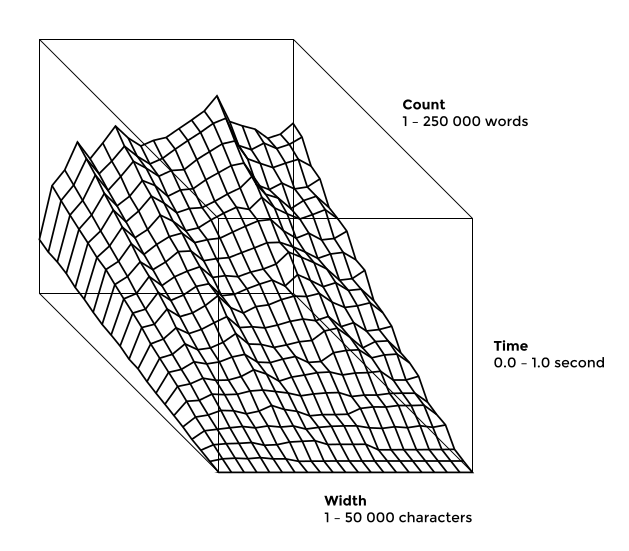
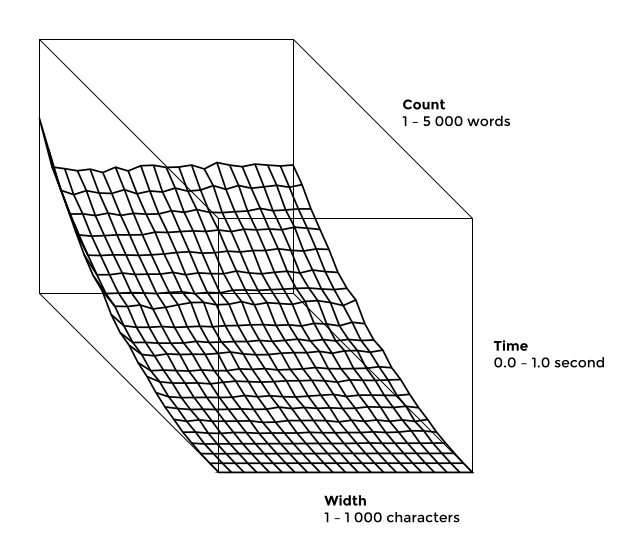
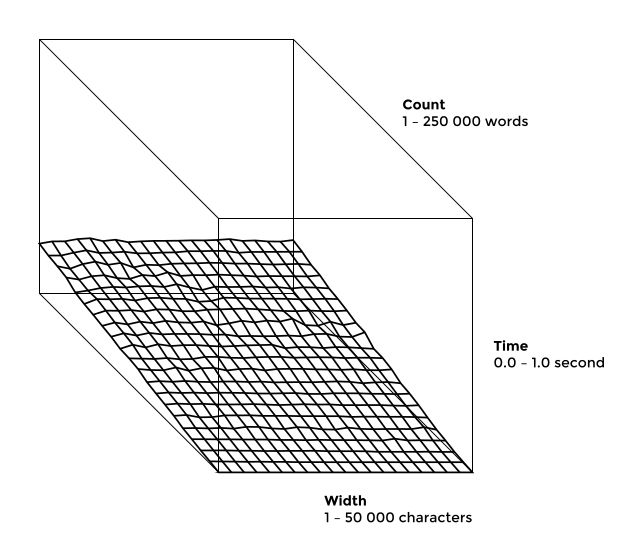
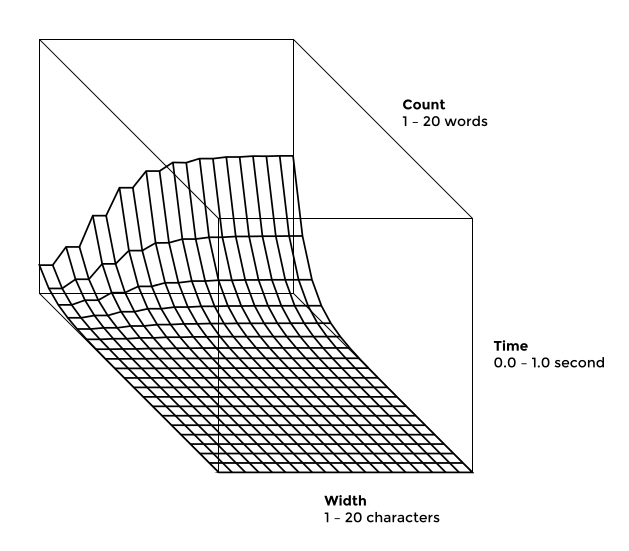
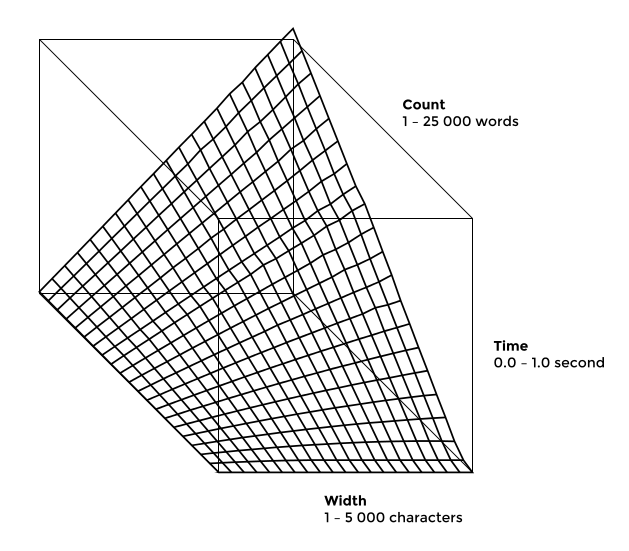
The entry is about visualizing the running time of various algorithms for an article [1] on line breaking. They range from the most naive exponential approach, though the kinds of dynamic programming and shortest path in directed acyclic graphs, binary search, to totally monotone matrix search which yields a linear time algorithm. The figures can be understood in two complementary ways: a method being compared to another method, and practical wall-clock time performance versus the theoretical asymptotic time complexity. In spite of the commonly recommended satisfactory length of line has no more than 75 characters, the analysis allowed for much wider lines to illustrate the overall rate of growth of a particular approach. Thus the main goal was to design the diagrams in most simple way so that the depicted performance surfaces can be contrasted easily. The taken times were the best of ten runs to smooth out the noise introduced by events such as loosing CPU to other processes or JIT compiler warm-up.
It uses a new open source graphic library called Flat [2] which is written in pure Python and hence has no external dependencies. The source code of the entry comes in three files: wrap.py implements the various algorithms and is the same as the code in the aformentioned article, comparison.py drives the generation of the figures, and plot.py which draws one diagram. The function plot() has several internal parameters to tweak the looks but it has no proper API as it was not meant to be published.
| [1] | http://xxyxyz.org/line-breaking/ |
| [2] | http://xxyxyz.org/flat/ |