Entry 8
Authors
- Stuart Mumford
Abstract
The solar corona, the multi-million degree upper region of the solar atmosphere, is much hotter than the underlying photosphere (or surface). Maintaining such extreme temperatures requires around 400 W m-2 energy to be constantly supplied to the plasma. This energy must be transported upwards from the photosphere. However, the mechanism, by which this happens, is as yet unresolved. Magnetohydrodynamic (MHD) waves, propagating along magnetic structures that connect the photosphere to the corona, have the potential to supply the required amount of energy to the corona.
MHD waves, due to the presence of a magnetic field, come in many different modes. Under idealised and uniform conditions there are three MHD wave modes, the fast and slow magnetoacoustic modes and the Alfv?n mode. These three modes have different properties: The slow mode primarily propagates parallel to magnetic field; the fast mode may propagate at most angles, with a bias to propagating perpendicular to the magnetic field; and finally the Alfven wave is a torsional or twisting motion of the magnetic field.
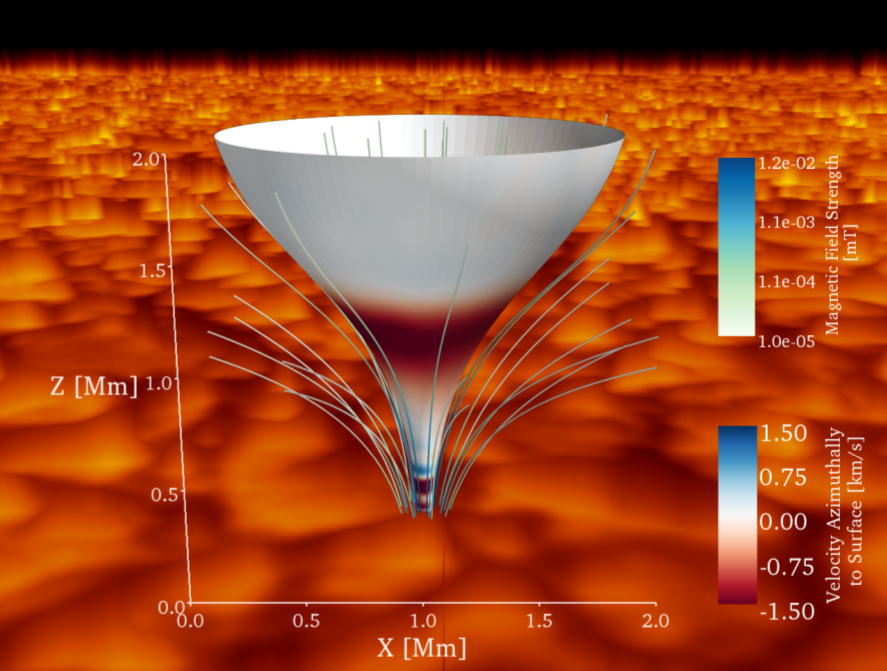
The photosphere (shown, to scale, at the base of the plot, using ground-based high-resolution ROSA/DST observations) is the top of the region of the Sun where convection dominates. It is where hot plasma rises, emits its energy as the radiation we see on Earth, and then sinks. This motion forces the magnetic field lines (shown as blue-white streamlines) which are locked into the plasma to compress in the ‘intergranular lanes’ (the darker regions on the base image in the plot) where cool plasma is sinking. The magnetic field lines shown are emanating from a representative intergranular lane, where the sinking plasma has been observed to generate spiraling motions (like water down a plug hole) which are then mimicked by a driver that has a logarithmic spiral velocity profile. As this magnetic field moves upwards through the solar atmosphere the density starts to dramatically decrease, causing the rapid expansion of the flux tube, hence its funnel-like shape.
To understand how this driver generates different MHD wave modes that might heat the corona it is required to identify them in the simulation. It is possible to approximate the separation of the wave modes by considering velocity components in the reference frame of the magnetic field (the components perpendicular, parallel and torsional to the magnetic field correspond to fast, slow, and Alfven modes, respectively). To achieve this in a 3D domain a ‘flux tube’ surface is created using tvtk from a ring of 100 fieldlines. This surface then determines a normal vector, which, combined with the magnetic field vector, gives the torsional vector. Once these vectors have been obtained for all the polygons on the surface the velocity can be decomposed onto the surface.
The surface shown in the plot has the Alfven mode (equivalent to the torsional component) overlayed. This mode contains ~60% of the total MHD wave energy. Note the first wave front propagating up the surface and other wavefronts emerging from the photosphere below it.