High-Level Plotting Procedures
There are two procedures that allow an application to simply draw a graph using a set of data.
Generated with CERN WebMaker
Table 2.58: Graph Drawing Functions.
gplotv is completely self-contained. The application simply passes an array of real values in the argument v and the number of elements in the array in npts. The arguments x1 and x2 may be used to specify the X-axis values to assign to the first and last elements of the data vector v. Finally, the argument title is a character string plotted at the top of the graph. This may be specified as EOS, a null string, in which case no title is plotted. Note that gplotv() does not require the graphics descriptor argument (gp here). Opening and closing graphics are done entirely within the procedure. On the other hand, gploto() does require the descriptor. That is, the graphics must have been opened by gopen() (see below). All other gio procedures require the graphics descriptor argument. gploto() therefore permits more flexibility in resetting default plotting parameters. Setup
These procedures enable graphics to be written to a particular device and control such operations as clearing the device (starting a new frame or page). 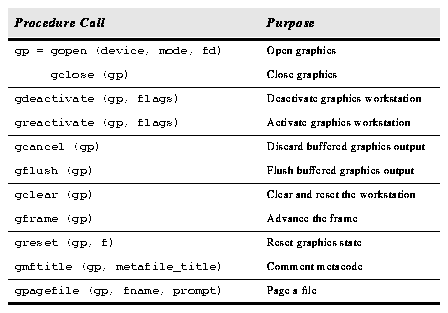
Table 2.59: Graphics Device Setup Functions.
Note the distinction between the arguments to gopen(). The first is a string specifying the device on which to plot. This is most often coded using a string assigned from a cl parameter to be assigned by the user. The second argument is the gio I/O mode, analogous to the fio I/O modes. This is usually coded using a parameter constant. NEW_FILE will initialize graphics, erasing the screen or starting a new page while APPEND will not initialize graphics but will use the scaling and other parameters from the most recent graph (as long as the graphics buffer was not flushed). The final parameter is the graphics stream to use for the graphics metacode output. There are three streams specified using defined parameter constants: STDGRAPH, STDPLOT, and STDIMAGE. The streams behave identically but are resolved separately in disposing of the final plot. Example 2.27 briefly demonstrates the most common way of opening graphics: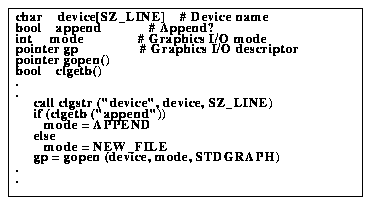
Graphics Parameters
There are a number of internal gio parameters that can be set in an SPP task. These control such aspects of the plot such as line width and text format. The system include file <gset.h> must be included to allow reading or writing these parameters. It is also possible to query, but not set, certain attributes of the specified graphics device.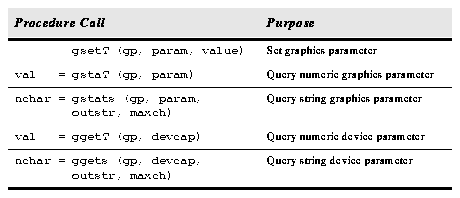
Table 2.60: Graphics Parameter Control Functions.
Use gsetT() to set the value of a parameter and gstatT() to inquire its value. Note the distinction between these procedures and the ggetT() procedures to query device characteristics from the graphics capabilities (graphcap) file. gsetT() is implemented for int, real, and string data types, gstatT() is implemented for int, and real data types, and ggetT() is implemented for bool, int, and real data types. Scaling
These procedures deal with plot scaling. There are two fundamental coordinate systems used by gio: normalized device coordinates or NDC, whose range is always 0:1 in both directions regardless of the device, and the world coordinate system or WCS, defined by the application and corresponding to the user's data coordinates.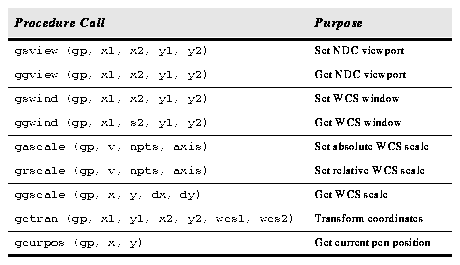
Table 2.61: Plot Scaling Functions.
NDC is associated with WCS using gsview() and gswind() to establish the plot scale. This may also be accomplished for a given set of data using gascale() or grscale(). Drawing
The usual graphics primitives are available in gio such as basic pen moves and draws, line, marker, polyline, polymarker, and text drawing. The coordinates in every case are assumed to be in world coordinates (WC).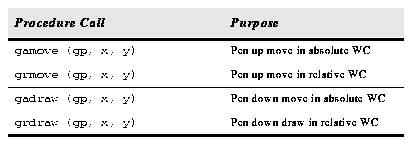
Table 2.62: Pen Movement Primitives.
Move and draw may be absolute or relative to the last pen position.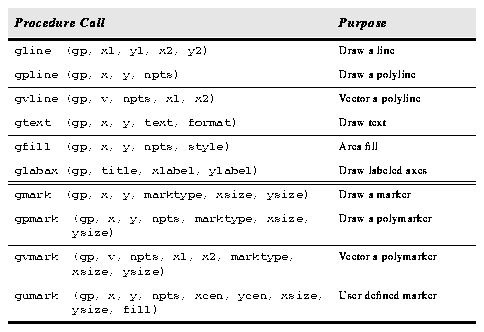
Table 2.63: Drawing Primitives.
gpline() and gpmark() take two vectors, with the X and Y coordinates of each point, while gvline() and gvmark() take a single vector of Y coordinates, and the X coordinates are evenly distributed along the X-axis, ranging from x1 at v[1] to x2 at v[npts] in WCS coordinates.
Table 2.64: Cell Array Primitives.
A cell array is a gray-scale image. It is up to the graphics kernels (device drivers) to support capabilities such as drawing cell arrays or filled polygons. Most of the kernels do not support these. Cursor Interaction
IRAF supports cursor read back through the cl so that a task may query the cursor. See "Interactive Graphics Cursor" on page 51 for a slightly more complete description of cursor interaction. 
Table 2.65: Cursor Interaction Functions.
Note that clgcur() is a clio procedure, not a gio procedure. Therefore, it does not require the graphics descriptor argument. Not all devices support moving the cursor from host software so gscur() may not have any effect.


