Entry 2
Authors
- Tony Perkins
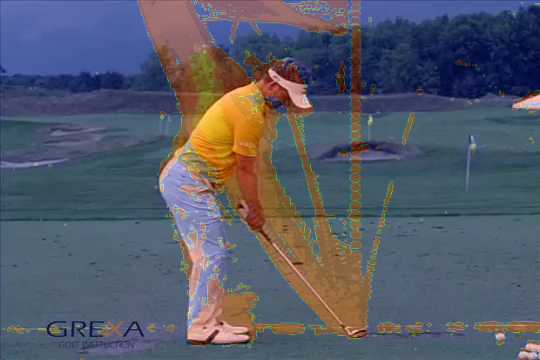
We had some simple fixed camera video footage which we wanted to do some sort of motion tracking analysis on. I used OpenCV to compare sequential frames. By simply taking the absolute difference with a threshold, frame-by-frame motion tracking is obtained. This motion tracking data which was allowed to accumulate as we advance through the video. The resulting dataset was graphed as a filled contour plot. The borders of the graph where removed, the result resized, and overlaid over the opening frame of the video. This final image makes for a very effective visualization of the video motion.
Products
Source
__author__ = 'tony'
import cv2
import numpy as np
import matplotlib.pyplot as plt


def _get_motion_detection_frame(previous_frame, current_frame):
    d1 = cv2.absdiff(current_frame, previous_frame)

    # increase THRESH for filtering more out
    THRESH = 15
    cv2.threshold(d1, THRESH, 255, cv2.THRESH_BINARY, dst=d1)
    return d1


if __name__ == '__main__':
    cap = cv2.VideoCapture('Luke Donald - slow motion golf swing.mp4')

    num_frames_read = 0

    success, frame = cap.read()

    cv2.imwrite('opening_frame.png', frame)

    while success:
        num_frames_read += 1
        current_frame = cv2.cvtColor(frame, cv2.COLOR_BGR2GRAY)

        '''
        Blurring the data removes some camera wiggle from showing up in the motion detection.
        Add more blur if you have lots of shakey cam.
        '''
        current_frame = cv2.GaussianBlur(current_frame, (5, 5), 0)

        if num_frames_read == 1:
            previous_frame = current_frame
        elif num_frames_read == 2:
            mdf = _get_motion_detection_frame(previous_frame, current_frame)
        else:
            mdf += _get_motion_detection_frame(previous_frame, current_frame)
            previous_frame = current_frame

        success, frame = cap.read()

        # If you want to set which frames are used.
        if num_frames_read == 3000:
            success = False

    heat_data = mdf[::-1, :]

    x, y = heat_data.shape
    x,y = np.mgrid[0:x, 0:y]
    f = heat_data[x, y]

    fig = plt.figure()
    plt.contourf(f, 10)
    ax = plt.subplot(111)
    ax.spines["top"].set_visible(False)
    ax.spines["bottom"].set_visible(False)
    ax.spines["left"].set_visible(False)
    ax.spines["right"].set_visible(False)
    plt.tick_params(axis="both", which="both", bottom="off", top="off",
        labelbottom="off", left="off", right="off", labelleft="off")
    fig.savefig('heatmap.png', pad_inches=0.0, bbox_inches="tight")
    cap.release()
    cv2.destroyAllWindows()

    hot_img = cv2.imread('heatmap.png')
    open_img = cv2.imread('opening_frame.png')
    x, y, z = open_img.shape

    big_hot_img = cv2.resize(hot_img, (y, x), interpolation=cv2.INTER_LINEAR)

    opacity = 0.3
    result_img = big_hot_img*opacity+open_img*(1-opacity)
    cv2.imwrite('final_image.png', result_img)