Entry 7
Authors
- Chian-Chou Chen
Since the time of Hubble, the shapes and the structures of galaxies have been one of the major topics in astrophysical research. Results from these morphological studies often provide vital constraints to the models of galaxy formation and evolution. One of the best telescopes nowadays that offer the sharpest images that allows astronomers to study their objects in the greatest detail is the Hubble Space Telescope (HST). HST has been, and continues to be, providing astrounding images that revolutionize our understandings of the Universe.
On the other hand, another telescope that is catching up to the legacy of HST is the Atacama Large Millimeter/submillimeter Array (ALMA). Unlike HST, ALMA observes in the millimeter wavelengths. Observations in this regime has given astronomer headache, because to provide an milimeter images that is as sharp as those obtained by HST, one needs to build a telescope that has a disk diameter of more than 2 km, which is practically impossible. To circumvent this issue, astronomers put together an array of telescopes, like ALMA, and then synthesize these small telescope to operate like a very large one. ALMA has just started working, and the results are revolutionary. Images taken by ALMA reveal unpresedented details about distribution of dust, which is a complimentary to the images taken by HST because dust is not detectable by HST. Combing the images taken by the two state-of-the-art telescopes, astronomers are pushing the frontier of our knowledge about galaxy formation and evolution even further.
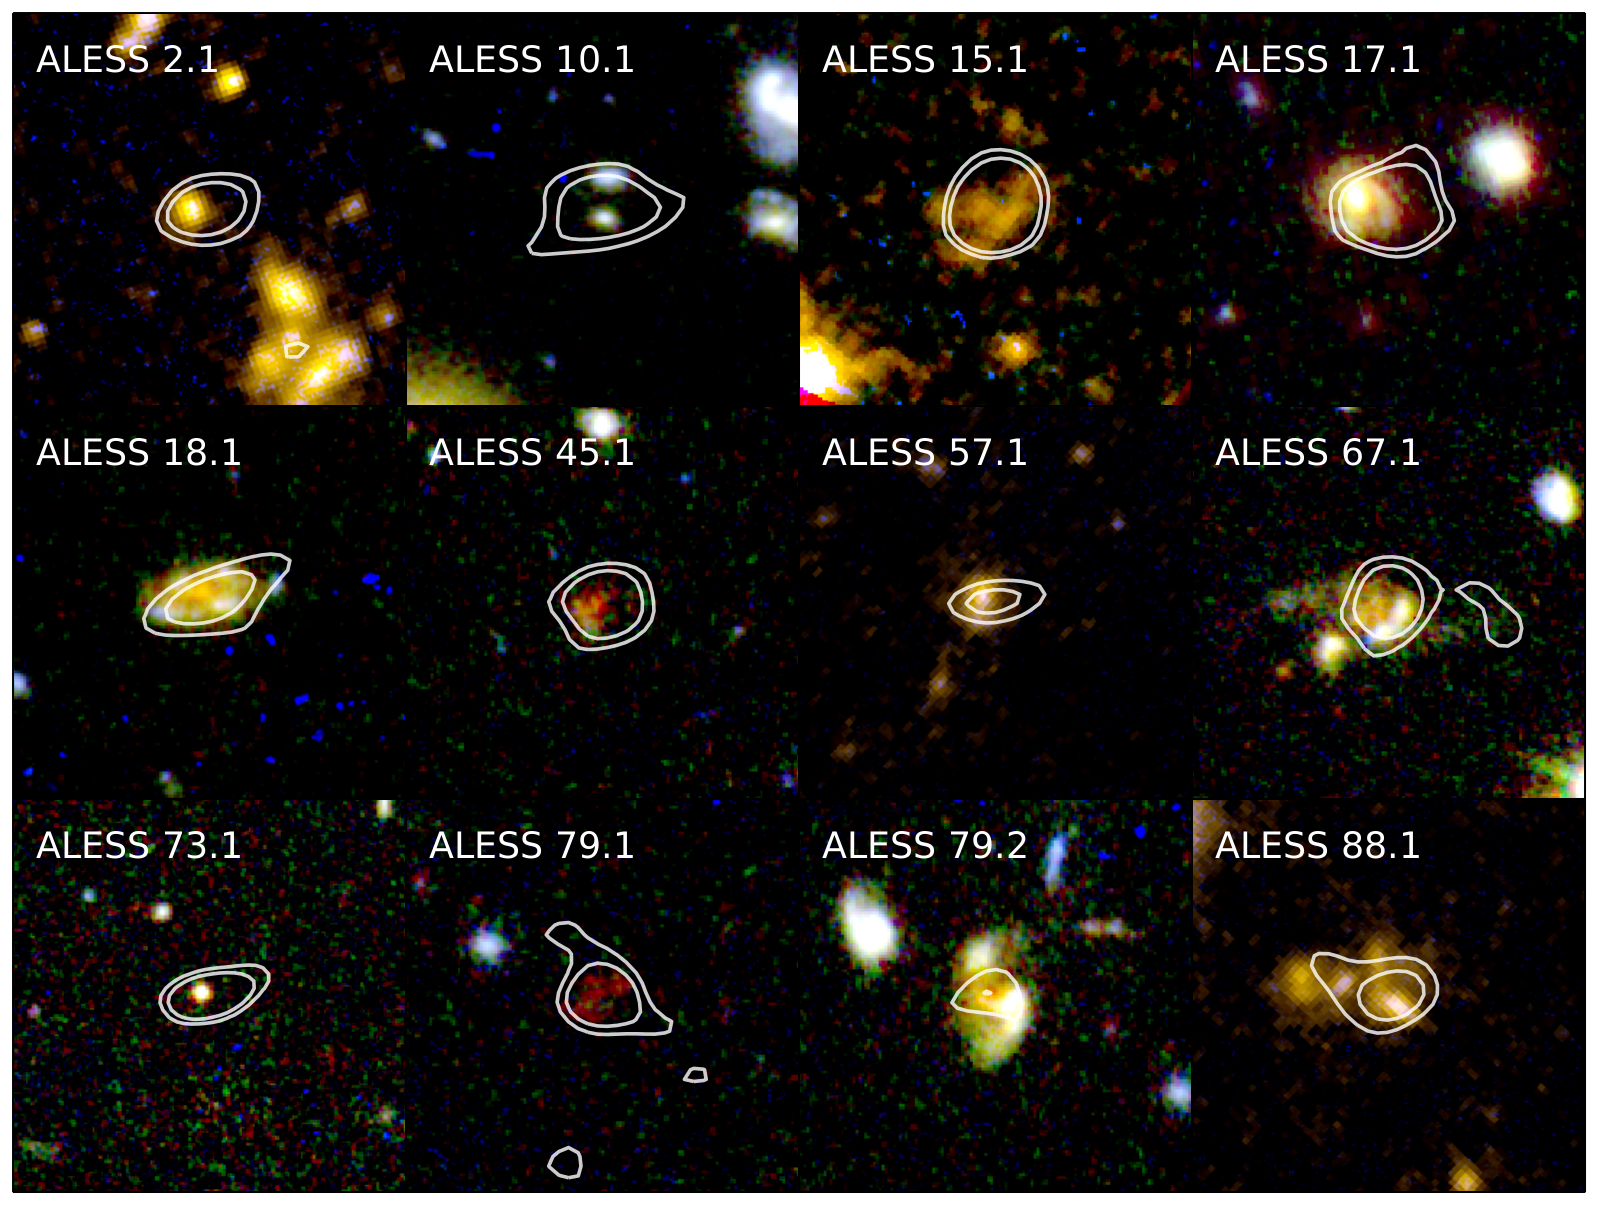
Here I present some of the images taken by both ALMA and HST that were used in my research. The results have recently been published in the Astrophysical Journal[1]. The galaxies shown in these images are so called the submillimeter galaxies (SMGs). SMGs are found to be the most violent star formers across the whole Universe. Astronomers believe that SMGs are forming stars in a rate that is 500 to 1000 times that of our own Milky Way galaxy. A natural question to ask, and a fundamental one, is how do galaxies form so many stars, and what makes them special? With the help of ALMA, for the first time astronomers can accurately pinpoint the location of SMGs in a very efficient way, which is critical because astronomers then can use this position to find out what do SMGs look like in the optical wavelength. In the image i show the signal obtained from ALMA in white contours and the color images are retrieved from the HST. In my study i find that SMGs have a mixture of shapes, but more than 80% of them are found to have very disturbed morphologies, suggesting that they might not be a single isolated galaxy, but two or even three galaxies that are in the process of merging together. So we conclude, because stars are formed from gas, by merging two galaxies, a lot of gas collides with each other, leading to an increase in gas density and therefore enhancement of the ability of forming stars.
[1] Chen, C.-C. et al., 2015, ApJ, 799, 194
Source
#!/usr/bin/python

"""
	colormontage.py : to plot color montage for any ALESS SMG with 2+ optical/NIR band from HST, modified for the SciPy John Hunter Excellence in Plotting Contest.
	Usage : python colormontage.py

	04/10/2015
	(c)	Chian-Chou Chen
"""
from kapteyn import maputils
from kapteyn import wcs
from scipy import interpolate
from scipy import stats
import coords as c
import aplpy
import PIL
import montage
import pyfits
import numpy as np
import matplotlib.pyplot as mpl
import asciitable
from astropy.io import fits
import asciitable
import os.path
from astropy import wcs
from coscal import coscalc

def rgbplt(srcid,imr,img,imb,num=3):
    aplpy.make_rgb_cube([imr,img, \
                         imb],'etc/'+srcid+'_hstrgb.fits',north=True)
    im=[imr,img,imb]
    vmx=[]
    vmn=[]
    for bb in im:
        hdu=pyfits.open(bb)
        hdudata=hdu[0].data
        dat=[]
        for ii in range(1,hdudata.__len__()):
            for jj in range(1,hdudata.__len__()):
                if hdudata[ii][jj] > 0:
                    dat.append(hdudata[ii][jj])
        vmx.append(stats.scoreatpercentile(dat,99.7))
        vmn.append(stats.scoreatpercentile(dat,50))


    if num == 3:
        if srcid == 'aless10.1' or srcid == 'aless18.1' or srcid == 'aless45.1' or srcid == 'aless67.1' or srcid == 'aless79.2':
            vmx=[1e-1,1e-1,1e-2]
            vmn=[5e-3,5e-3,1e-3]
        if srcid == 'aless17.1' or srcid == 'aless17.2' or srcid == 'aless17.3':
            vmx=[6e-1,1.4e-1,2e-2]
            vmn=[6.3e-03,1e-02,4e-4]
        if srcid == 'aless45.1' or srcid == 'aless79.1':
            vmx=[8e-2,8e-2,8e-3]
            vmn=[5e-3,5e-3,1e-3]
        if srcid == 'aless13.1':
            vmx=[1.4e-1,1.5e-1,2e-2]
            vmn=[6e-03,8e-03,4e-3]

        aplpy.make_rgb_image('etc/'+srcid+'_hstrgb.fits','etc/'+srcid+'_hstrgb.tif', \
                             stretch_r='log',stretch_g='log',stretch_b='log',\
                             vmin_r=vmn[0], vmax_r=vmx[0], vmin_g=vmn[1], vmax_g=vmx[1], vmin_b=vmn[2], vmax_b=vmx[2], \
        )
    elif num == 2:
        vmx=[3e-01,9,1e-2]
        vmn=[5e-03,1.e-01,8e-4]
        if srcid == 'aless15.1' or srcid == 'aless15.2' or srcid == 'aless15.3' or srcid == 'aless15.6':
            vmx=[1e-01,3,9e-3]
            vmn=[5e-03,1.e-01,8e-3]
        if srcid == 'aless74.1' or srcid == 'aless43.1' or srcid == 'aless43.3':
            vmx=[4e-01,10,2e-2]
            vmn=[6e-03,1.5e-01,5e-3]
        if srcid == 'aless88.1' or srcid == 'aless88.11' or srcid == 'aless57.1':
            vmx=[4e-01,10,2e-2]
            vmn=[6e-03,1.5e-01,2e-3]
        if srcid == 'aless2.1' or srcid == 'aless2.2':
            vmx=[2e-01,5,1e-2]
            vmn=[6e-03,1.5e-01,3e-3]
        if srcid == 'aless5.1':
            vmx=[4,100,2e-1]
            vmn=[6e-03,9e-01,5e-3]
        if srcid == 'aless118.1':
            vmx=[4e-01,10,2e-2]
            vmn=[6e-03,5e-01,1e-2]

        aplpy.make_rgb_image('etc/'+srcid+'_hstrgb.fits','etc/'+srcid+'_hstrgb.tif', \
                             stretch_r='log',stretch_g='log',stretch_b='log',\
                             vmin_r=vmn[0], vmax_r=vmx[0], vmin_g=vmn[1], vmax_g=vmx[1], vmin_b=vmn[2], vmax_b=vmx[2], \
        )


def plot1setting(fig,srcid,bxcd,bycd,photoz):
    if photoz == 99:
        photoz = 2.3
    distscl=coscalc(photoz)
    bxszkpc=70.
    wh = bxszkpc/distscl[0]/3600.
    rad = 0.8/3600.
    print srcid, photoz, distscl[0], wh
    fig.recenter(bxcd,bycd,width=wh,height=wh)
    # Axis
    fig.axis_labels.hide()
    fig.tick_labels.hide()
    fig.ticks.set_length(0)
    # IDs
    xcdoff=bxszkpc/distscl[0]/3600./2
    ycdoff=bxszkpc/distscl[0]/3600.*3/4/2
    fig.add_label(bxcd+xcdoff,bycd+ycdoff,' '.join(' '.join(srcid.upper()[i:i+5] for i in range(0, len(srcid), 5)).split()),size=20,color='white',weight='normal',horizontalalignment='left',verticalalignment='center')

def main():
    almapth='./'
    almatab=pyfits.open(almapth+'sources_aLESS_24jul2012_brightcal_M+S_IRAC_Radio_24+HSO+PACS.fits')
    alessidall=almatab[1].data.ALESS_ID
    alessra=almatab[1].data.RA_ALMA
    alessdec=almatab[1].data.DEC_ALMA
    lessid=almatab[1].data.NAME_LESS
    alessrms=almatab[1].data.RMS_ALMA
    alessphotoz=np.abs(almatab[1].data.Z_PHOT)
    alessids=[]
    for mm in alessidall:
        field=mm.split(' ')[0].lower()
        numb=str(float(mm.split(' ')[1]))
        alessids.append(field+numb)
    alessids=np.array(alessids)

    # get HST observed ALESS SMG IDs
    hstidtab=asciitable.read('srclist.tab')
    hstid=hstidtab.ID

    # plot
    fig = mpl.figure(figsize=(12, 9))
    raw=0
    numcoll=3
    coll=numcoll
    deltacoll=1/3.
    numraw=4
    deltaraw=1/4.


    mpl.subplots_adjust(left=0,right=1,top=1,bottom=0,wspace = 0.00001,hspace = 0.000001)
    pth = './cutimg/'
    artgpth= './cutimg/'
    for srcid in alessids:
        cntst=np.where(hstid == srcid)
        if len(cntst[0]) == 1:
            flext=['814','105','125','160']
            chckn=0
            for bb in range(0,len(flext)):
                chck=os.path.isfile(pth+srcid+'_'+flext[bb]+'.fits')
                if chck == True:
                    chckn=chckn+1

            if chckn > 1:
                cnnum=np.where(alessids == srcid)
                lessfile=lessid[cnnum][0]+'.fits'
                srcalessrms=alessrms[cnnum][0]*1e-3
                if chckn >= 3:
                    chck=os.path.isfile(pth+srcid+'_814.fits')
                    if chck == True :
                        imb=pth+srcid+'_814.fits'
                        img=pth+srcid+'_125.fits'
                        imr=pth+srcid+'_160.fits'
                        rgbplt(srcid,imr,img,imb)
                    else:
                        imb=pth+srcid+'_105.fits'
                        img=pth+srcid+'_125.fits'
                        imr=pth+srcid+'_160.fits'
                        rgbplt(srcid,imr,img,imb)


                    f = aplpy.FITSFigure('etc/'+srcid+'_hstrgb_2d.fits',figure=fig, subplot=[deltaraw*raw,deltacoll*coll,deltaraw,deltacoll])
                    f.show_rgb('etc/'+srcid+'_hstrgb.tif')
                    cnaless=np.where(alessids == srcid)
                    plot1setting(f,srcid,alessra[cnaless][0],alessdec[cnaless][0],alessphotoz[cnaless][0])
                    # rms contours
                    constart=srcalessrms
                    constep=srcalessrms
                    #levs1 = constart+np.arange(2,15,3)*constep
                    levs1 = constart+np.array([2,4,49,99])*constep
                    print lessfile
                    f.show_contour(almapth+'almamaps/'+lessfile,colors='white',levels=levs1,linewidths=2,linestyles='solid',alpha=0.8)
                elif chckn == 2:
                    imb=pth+srcid+'_814.fits'
                    if srcid == 'aless118.1':
                        imb=artgpth+'../aless118.1/'+srcid+'_814_sex_noobj.fits'
                    img=artgpth+srcid+'_greenv2.fits'
                    imr=pth+srcid+'_160.fits'
                    rgbplt(srcid,imr,img,imb,num=chckn)

                    f = aplpy.FITSFigure('etc/'+srcid+'_hstrgb_2d.fits',figure=fig, subplot=[deltaraw*raw,deltacoll*coll,deltaraw,deltacoll])
                    f.show_rgb('etc/'+srcid+'_hstrgb.tif')
                    cnaless=np.where(alessids == srcid)
                    plot1setting(f,srcid,alessra[cnaless][0],alessdec[cnaless][0],alessphotoz[cnaless][0])
                    # rms contours
                    constart=srcalessrms
                    constep=srcalessrms
                    levs1 = constart+np.array([2,4,49,99])*constep
                    if srcid == 'aless88.11':
                        levs1 = (constart+np.array([2,4,49,99])*constep)/1.182
                    print lessfile
                    f.show_contour(almapth+'almamaps/'+lessfile,colors='white',levels=levs1,linewidths=2,linestyles='solid',alpha=0.8)


                raw=raw+1

                if raw == numraw:
                    coll=coll-1
                    raw=0

    f.save('colormontage.pdf')

if __name__=='__main__':
        main()